

Make use
of your data
 Whatsapp our expert
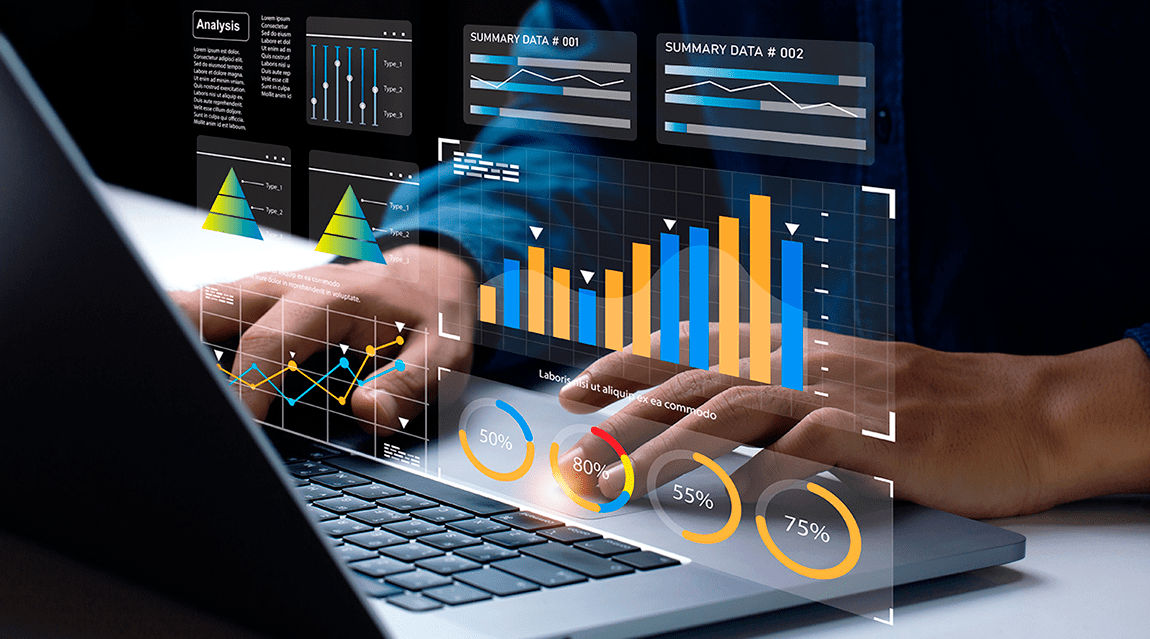
Digital Q.Sensor is a cross-industry platform for business analytics and interactive data visualization.
- Take informed data-driven managerial decisions
- Implement timely changes to business processes based
on interactive real-time analysis of business data
Visualize
and Customize
Successful managers have to be able to make quick business decisions to enable the best business results
and achieve company goals.
and achieve company goals.
Visualize your data, customize interactive dashboards, track dependencies and take decisions based on the information rather than probability
0 +
Preset visual elements: Gantt charts, 2D and 3D diagrams, heatmaps, tables, maps.
REAL-TIME
Generation of charts
< 0 minutes
Average generation of custom charts
0 +
Ready-to-use customizable dashboards
Who should use
the platform?
Business User
- Managing Director
- Chief Financial Officer
- HR director
- Production Director
- Manager
Industry
- Financial Service Companies
- Banks
- MFOs
- Manufacturing Companies
- Retailers
- Government Authorities (Traffic Authority, Emergency, Ministry of Ecology and Natural Resources, Environment Authorities)
Business Tasks
- Operations Management
- Financial Planning
- Situation Centers
- Monitoring of Equipment
- Business Motivation, KPIs and Gamification
- Routine User Tasks
- Monitoring of Business Processes
Variety of
options
ENTERPRISE-WIDE monitoring
Establish centralized control centers to enable company-wide monitoring of business processes and performance
SELF-SERVICE
Visualize data to help users solve their specific business tasks (monitoring of teams, KPIs, decision management, etc.)
EMBEDDED analytics
Publish your analytical charts into any user application: CRM, sales management, other business applications
How it
works
Collect data
Visualize
Analyze and interact

Take decisions
Collect data
- Collect data from relational and non-relational databases: Oracle, PostgreSQL, MSSQL, Greenplum, ClickHouse, etc.
- Import data from EXCEL files
- Input data manually

Visualize information
- Select charts from the vast list of ready-to use customizable templates (400+ types of visual representations: Gantt charts, 2D and 3D diagrams, heatmaps, tables, maps, etc.)
- Set up your own charts using No-Code tools
- Customize dashboards and charts with JavaScript tools
Analyze and interact with information
- Trace trends
- Track incidents
- Monitor changes
- Drill down to any depth of detail
- Flexibly filter and zoom data
- Filter charts by selecting elements directly on the chart (Click one element to re-build the rest of the dashboard and analyze the selected analytical dimension)
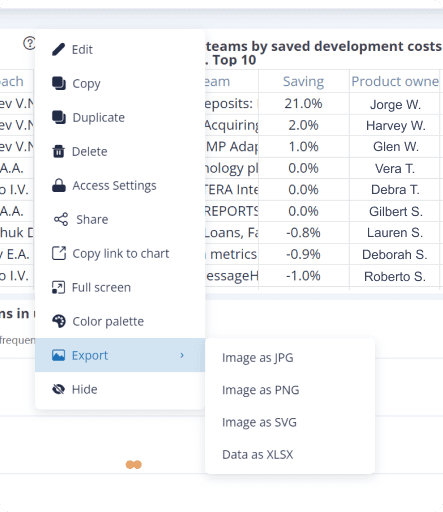
- Export charts and dashboards to PDF, CSV, Excel files, vector or raster images.

Take decisions
- Streamline business processes based on the data analysis
- Quickly respond to incidents
- Take measures based on the level of risk
- Facilitate routing tasks with visual evaluation of the current state of business processes
- Improve business motivation and manage KPIs, ratings, incentives. Make every effort of your employees visible and meaningful

Flexibility and
Interactive Analysis
-
Easy designEasily create comprehensive interactive dashboards using convenient visual low-code development tools.
-
Different data sourcesCombine multiple data sources in a single dashboard supporting large amounts of data. The solution is compatible with any databases, OLTP systems, CRM, ERP, core banking systems and data warehouses.
-
Multiple optionsChoose from the vast variety of preset customizable interactive dashboards, charts and visualization tools.
-
Mobile versionTake your analytical data wherever you need it.
-
PersonalizationQuickly design your custom business monitoring system with personalized targets, priorities, KPIs and other metrics, and track these metrics in real time.
-
Easy publishing and sharingIntegrate analytical tools as widgets into any user system: user workstation, corporate portals, digital channels, CRMs, ERP systems, etc.
-
Drill-down and zoomingInvestigate complex cases and dependencies zooming in and drilling down to any depth of detail. Trace trends by visualizing data on the interactive map.
Use
Сases
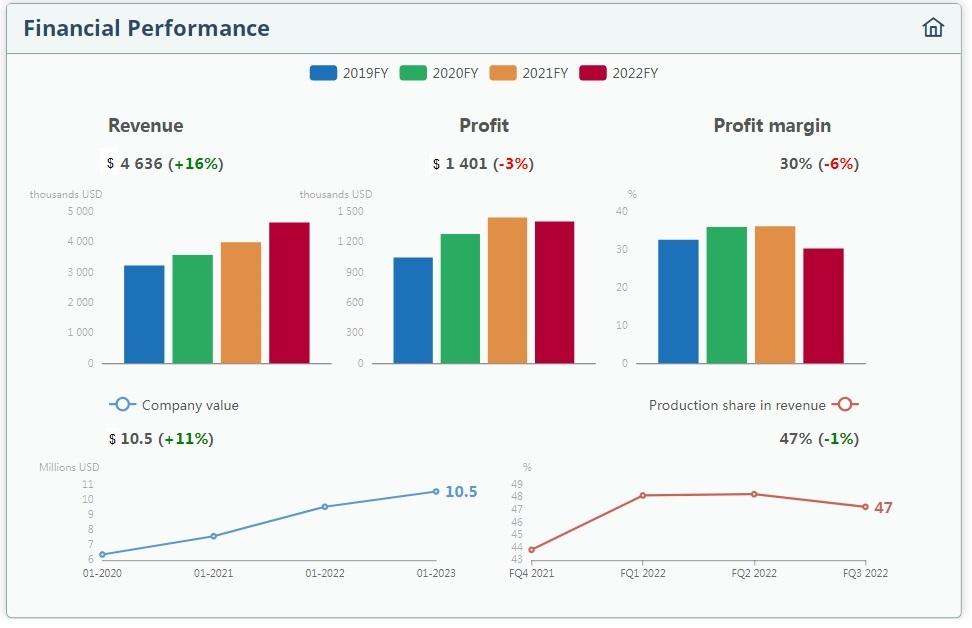
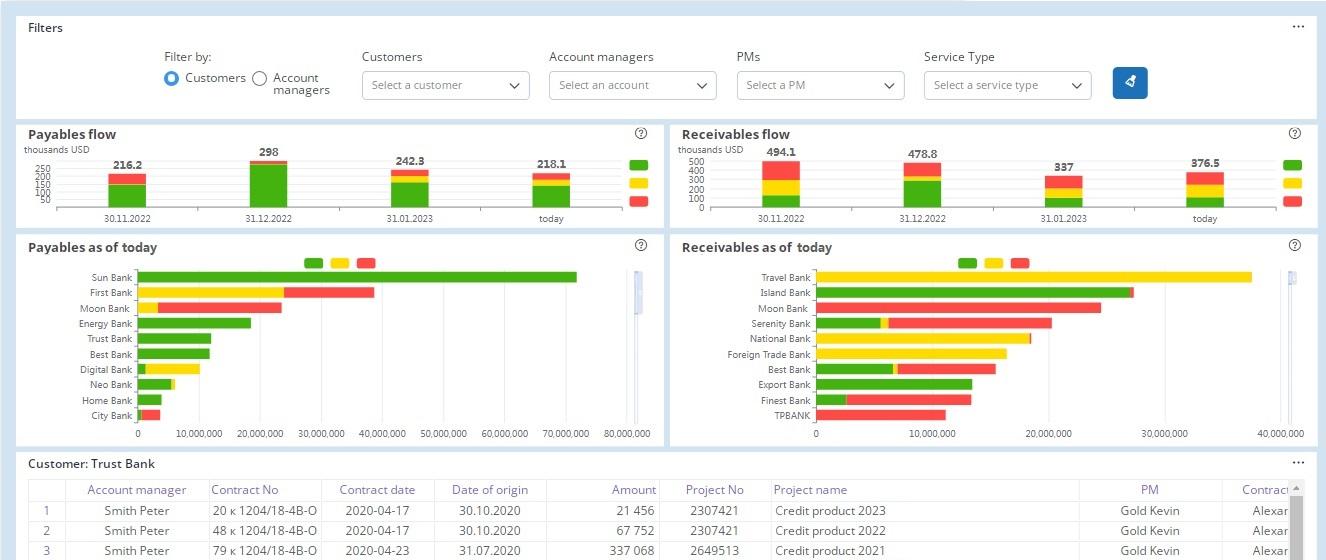
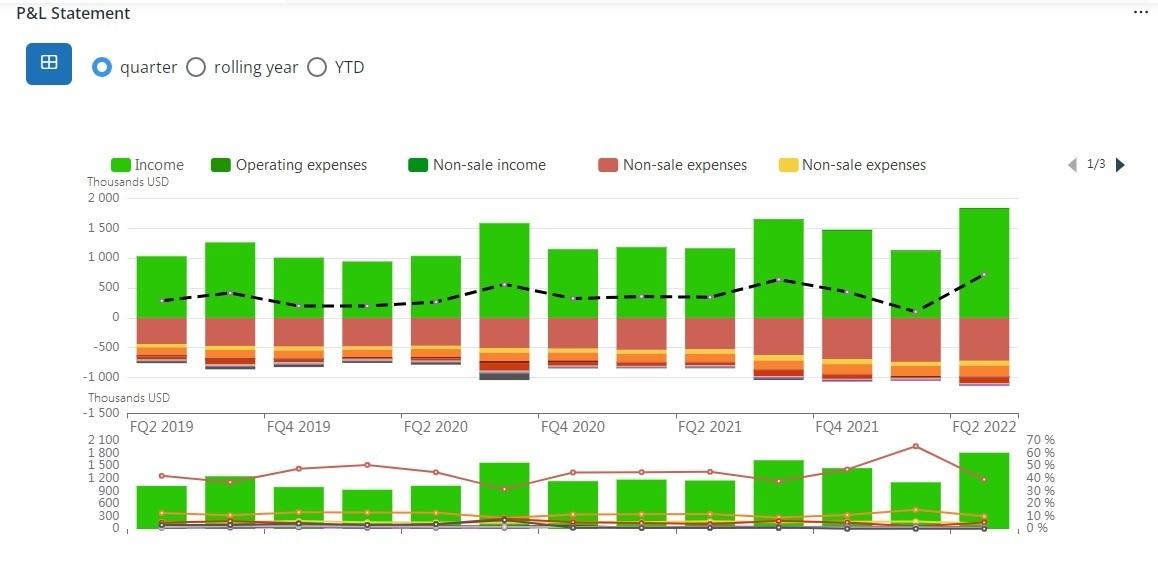
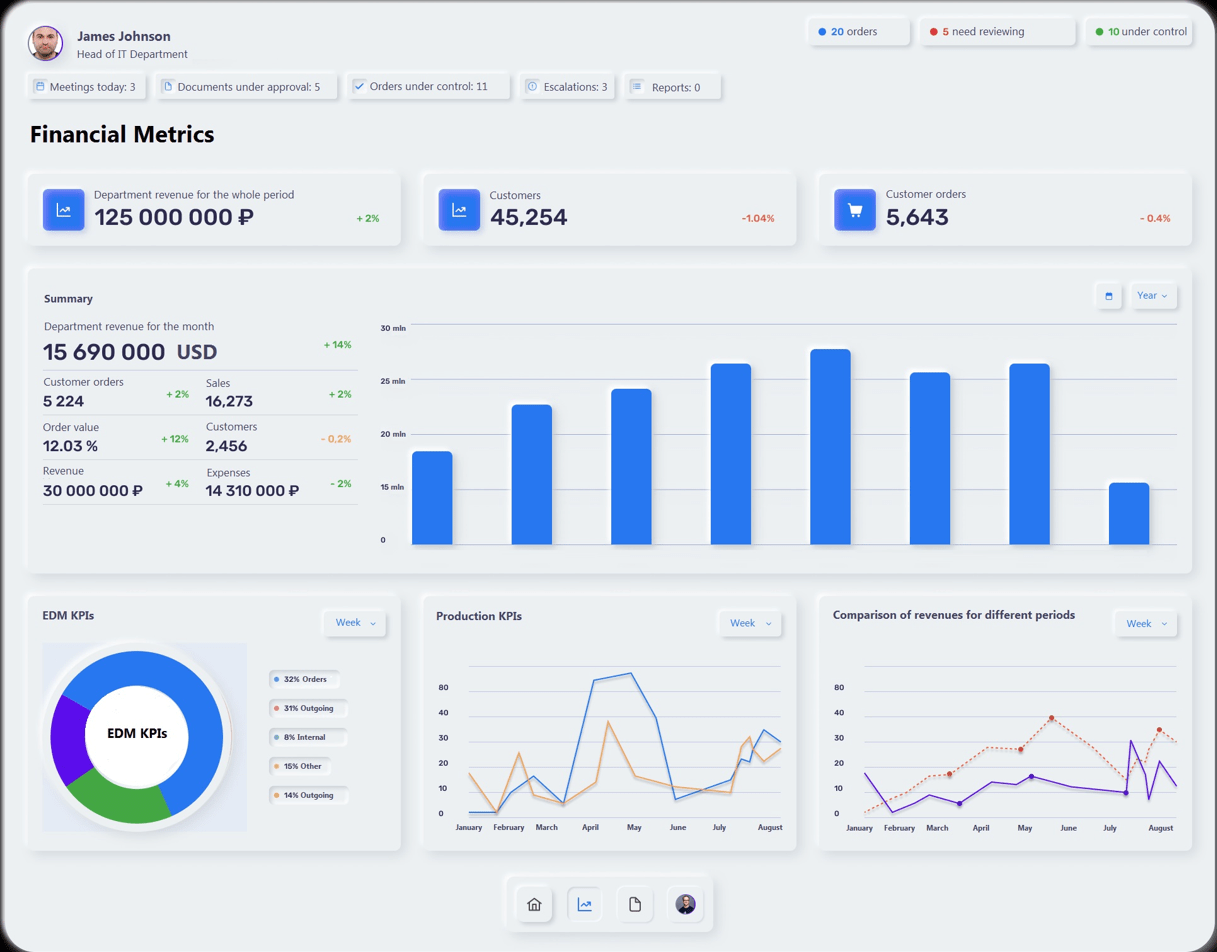
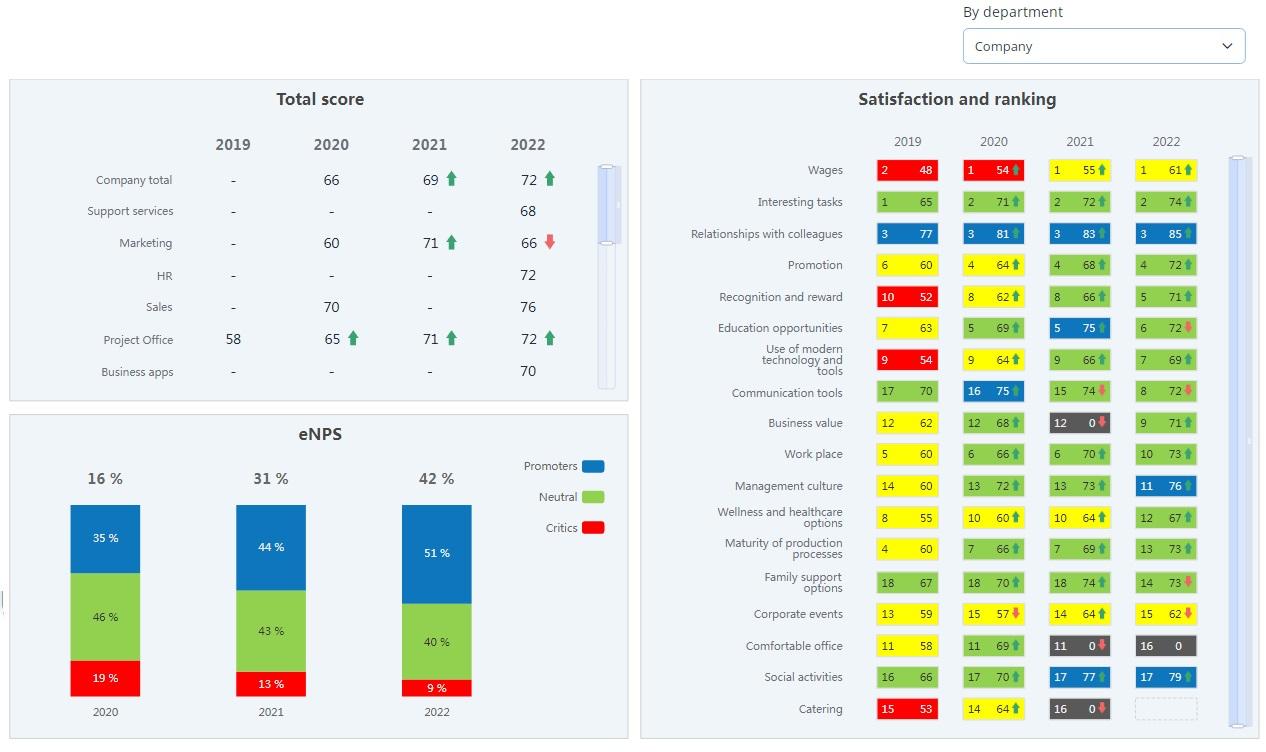
Company management
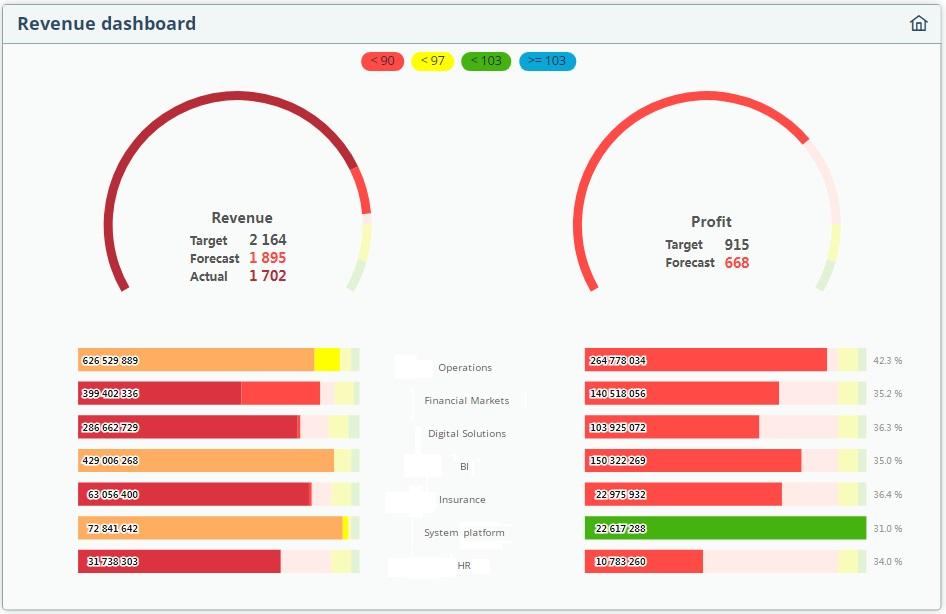
- Business KPIs and performance
- Customer payables and receivables
- P&L, cost management
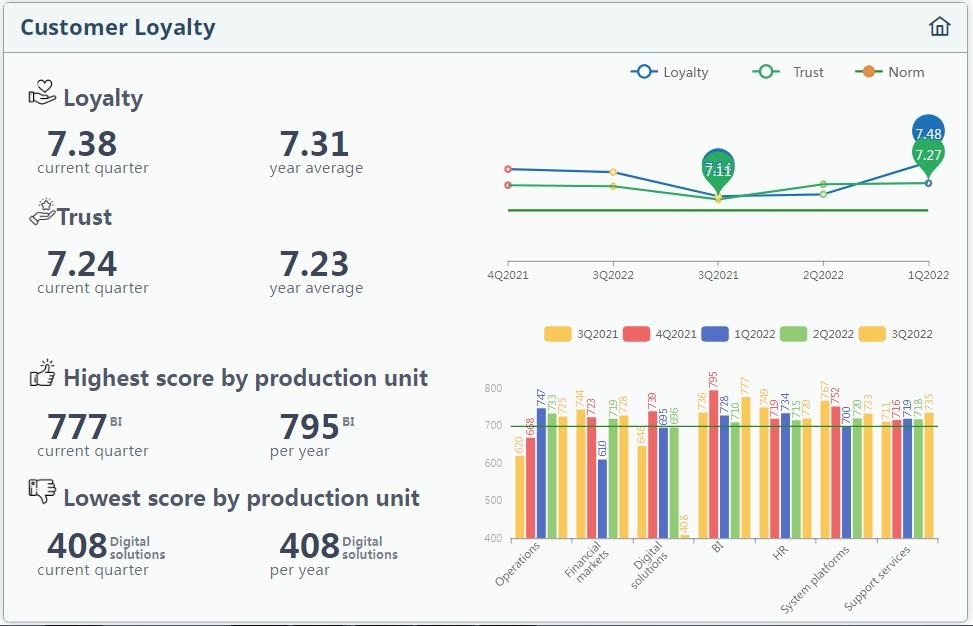
- Sales management, customer loyalty
- HR management
- Income and profit
- Financial planning and budgeting
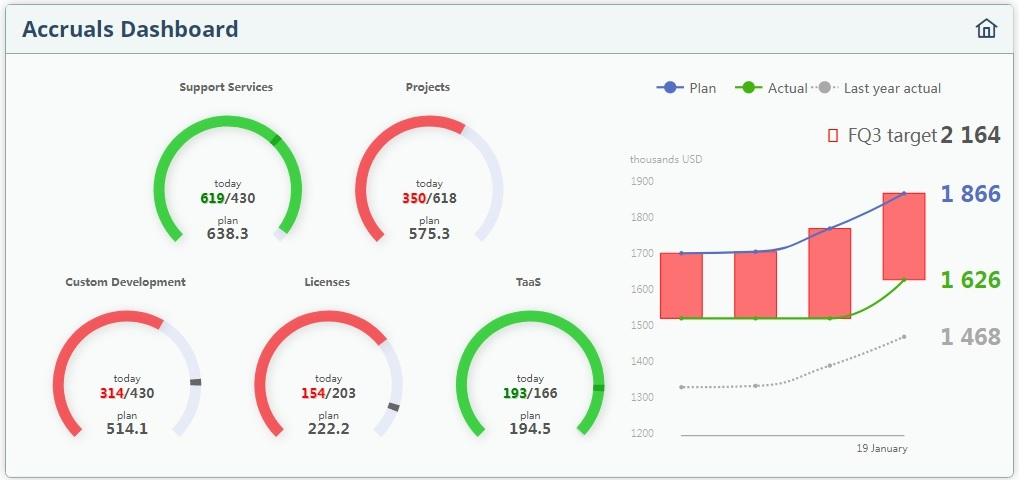
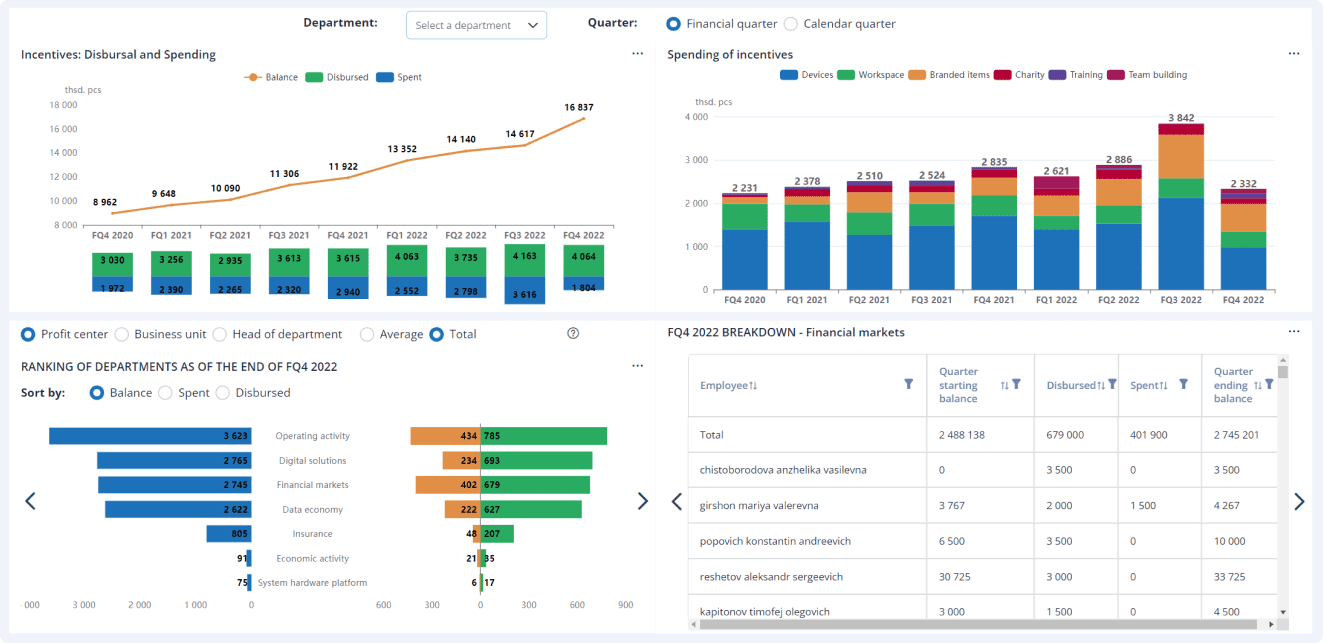
Control center
- Accruals dashboard
- Performance-to-plan dashboard
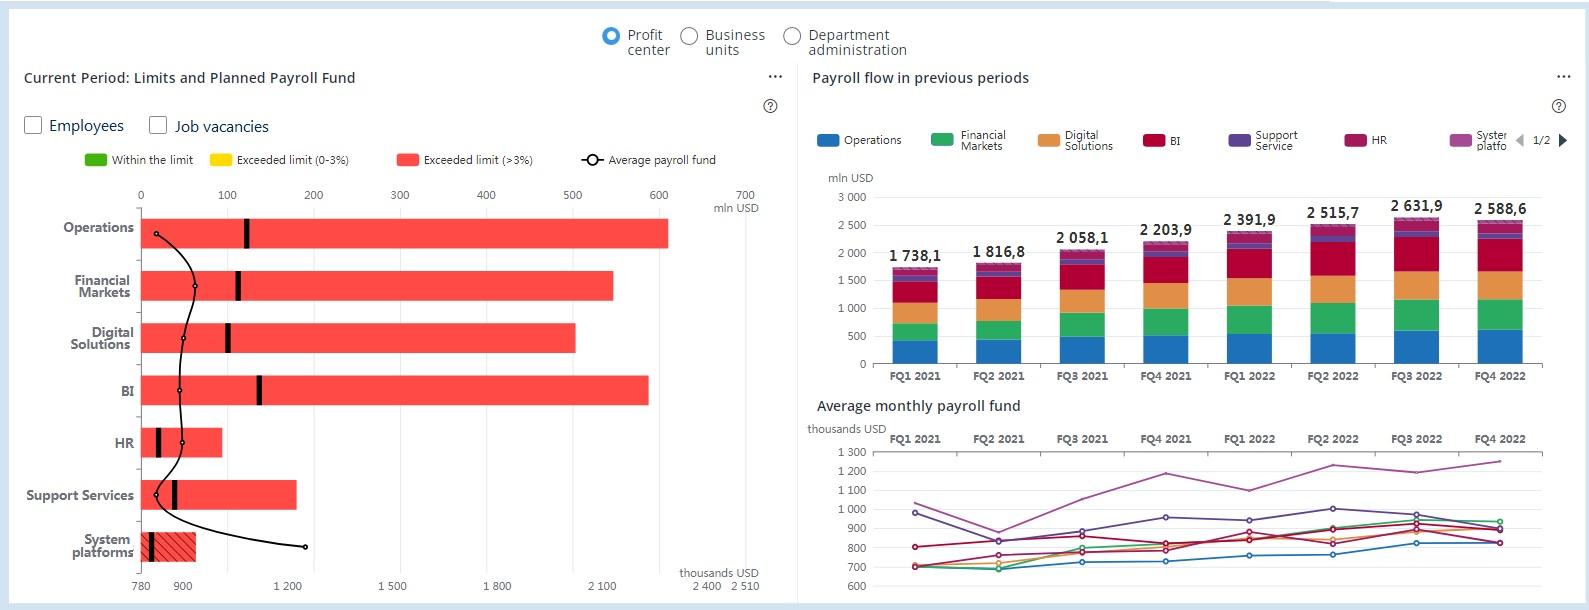
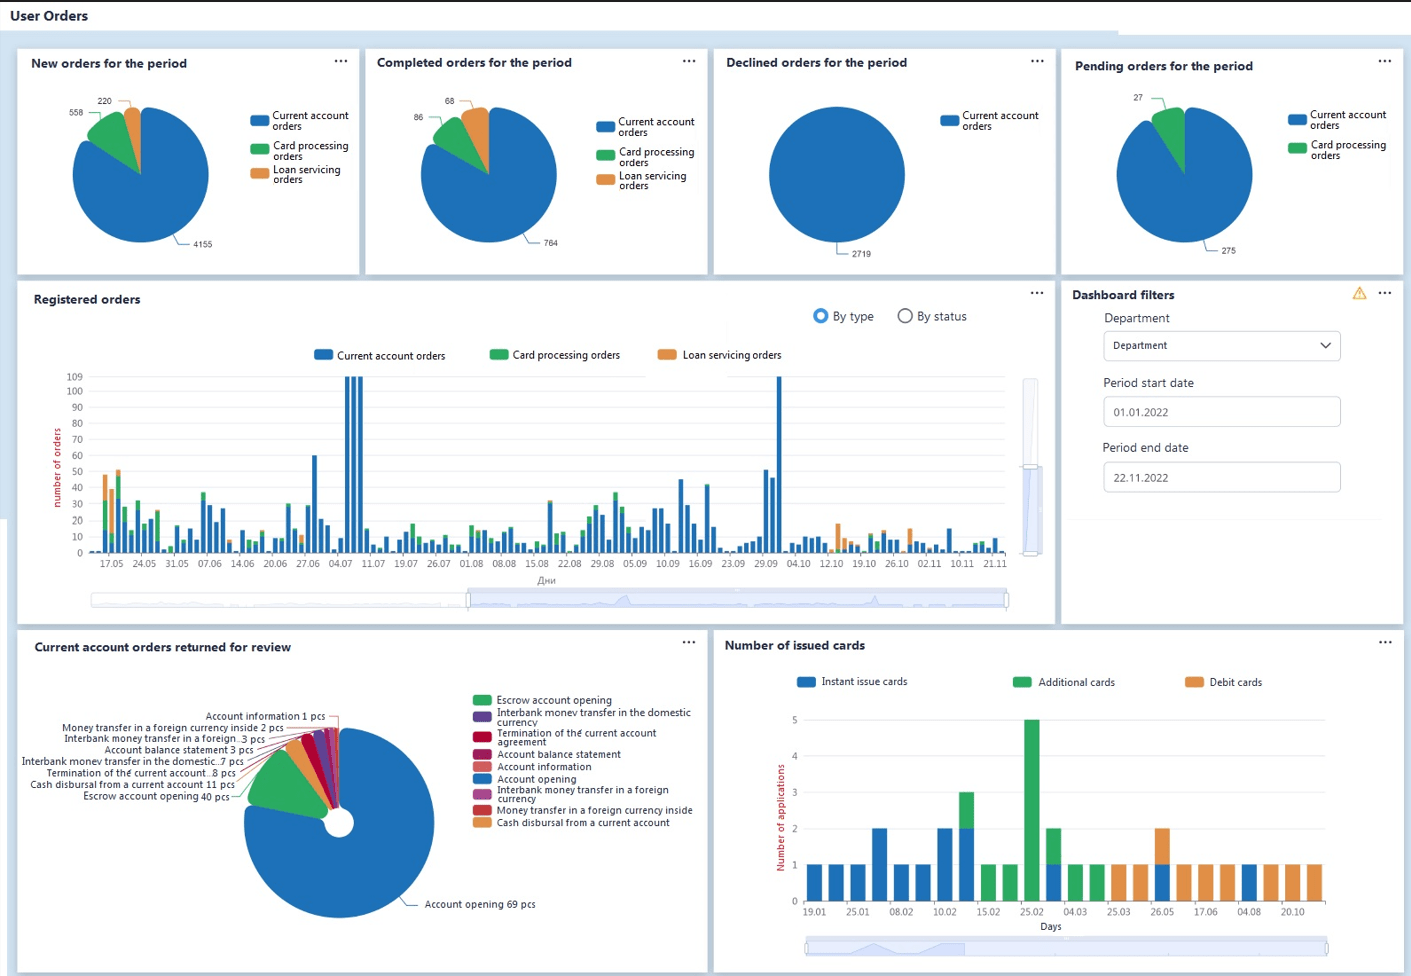
Routine user tasks
- Payroll dashboard
- User tickets
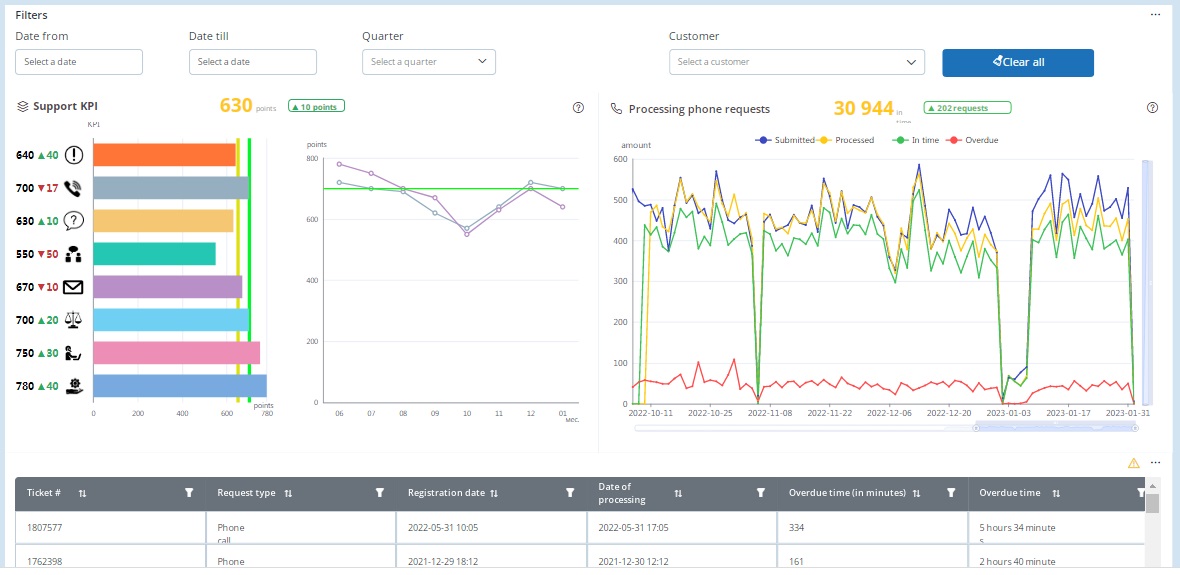
- Sales manager’s personal dashboard
- Support monitoring
Business motivation
- Monitoring personal KPIs by user / supervisor / team
- Analysis of team performance
- Competition between users, departments and business units
- Gamification and incentives
- Employee satisfaction and loyalty
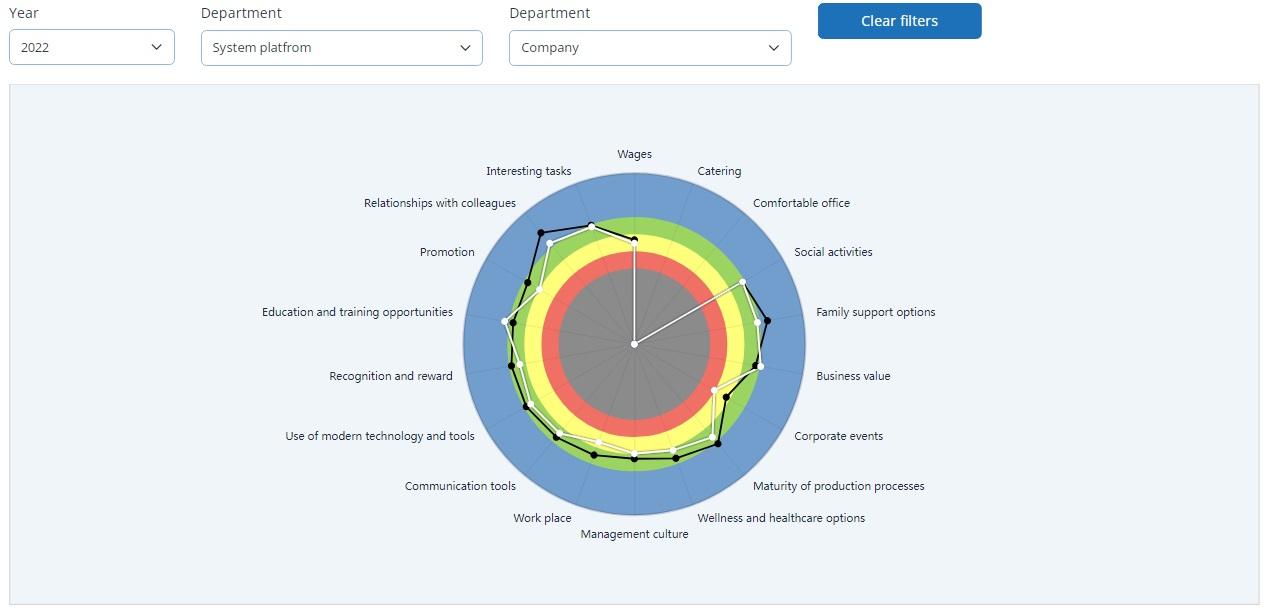
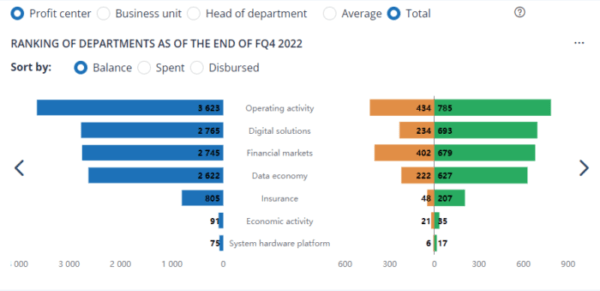
Visual
components
Multidimensional
analysis
analysis
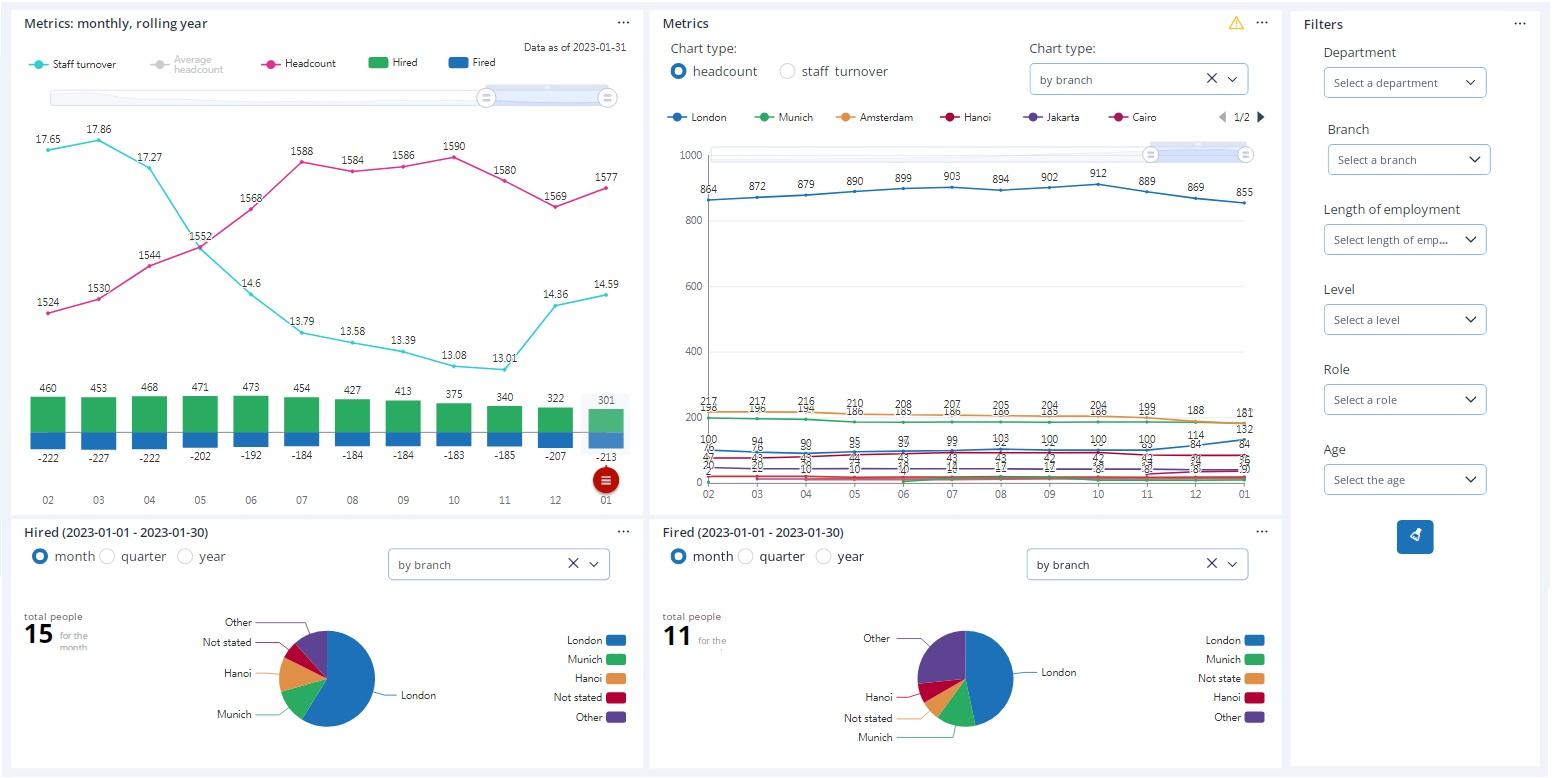
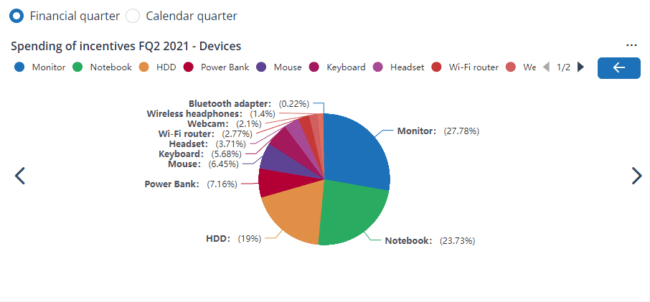
Organize data in meaningful hierarchies, filter tables and charts, analyze separate dimensions, zoom in, use chart elements as filters and re-generate linked diagrams based on the selected element.
Filter data by chart elements
Filter tables to analyze separate data arrays
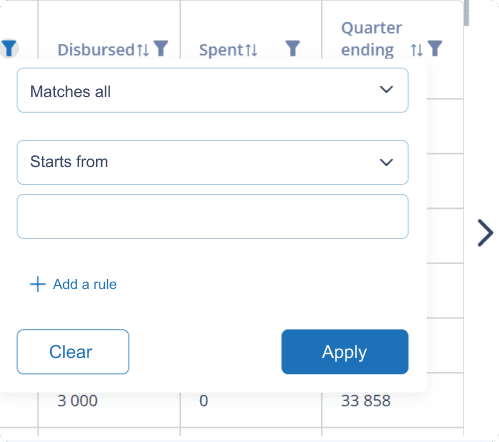
Use drop-down filters to select data
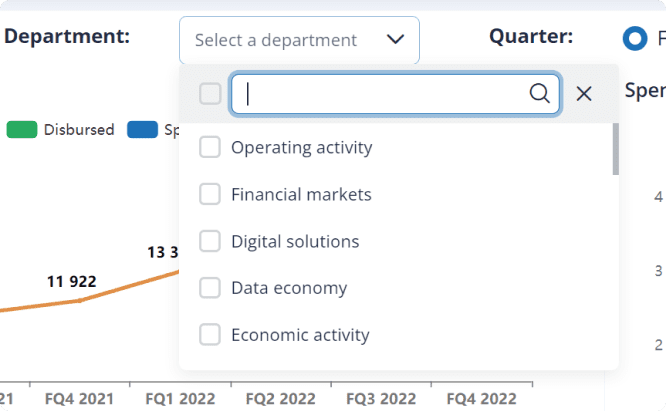
Drill down to any depth of detail
Use infotips to analyze the concise summary of a chart item
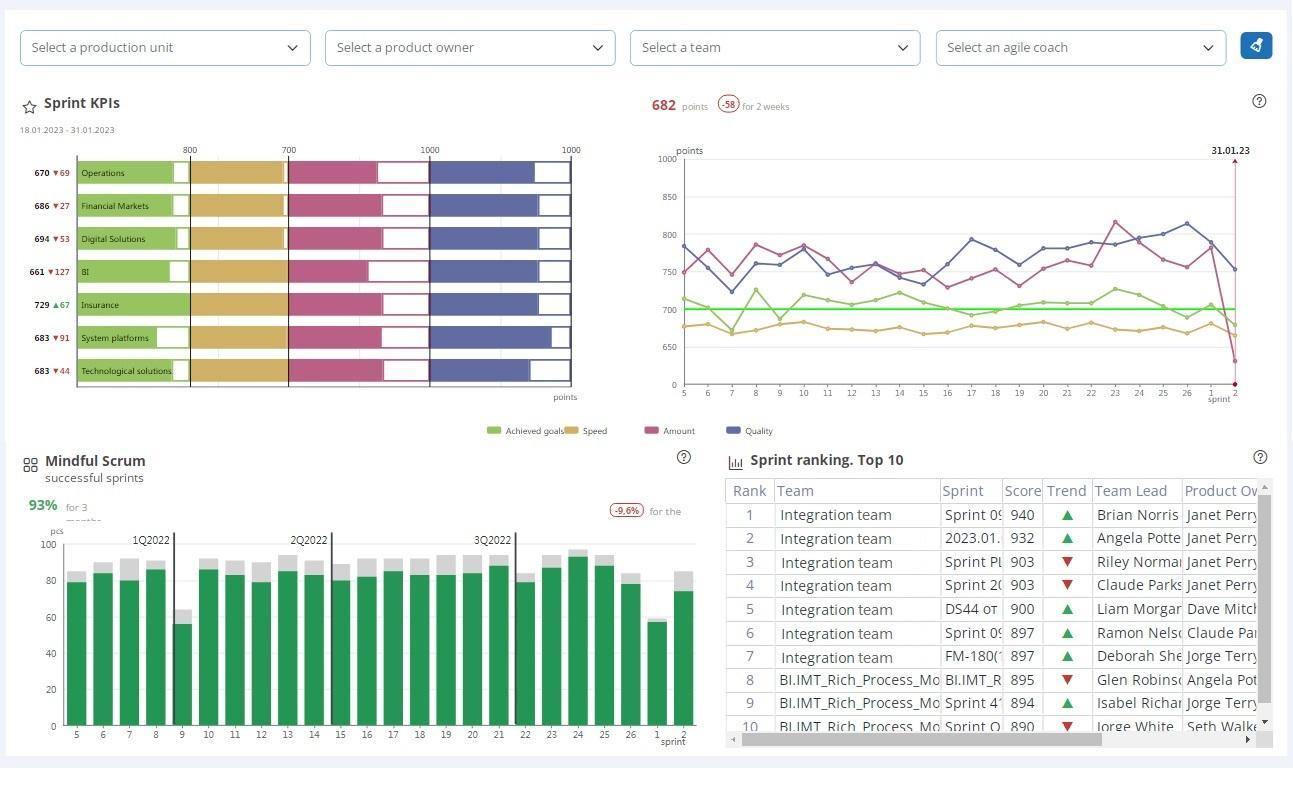
Interactive
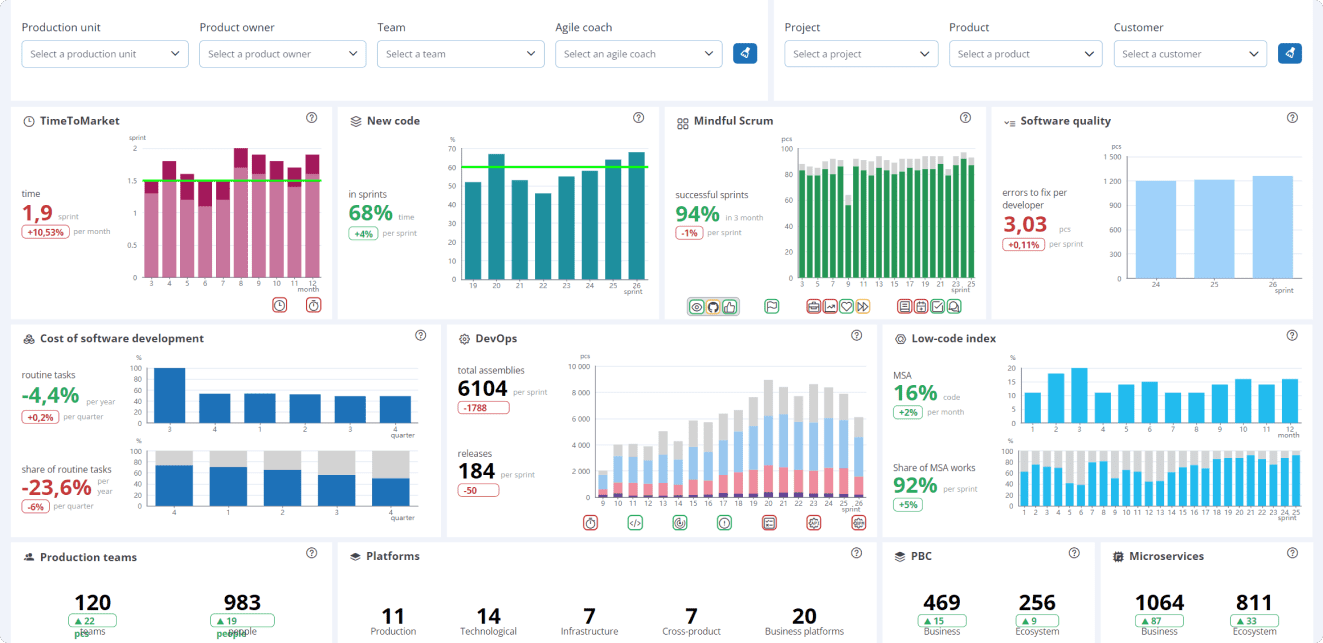
dashboards
dashboards
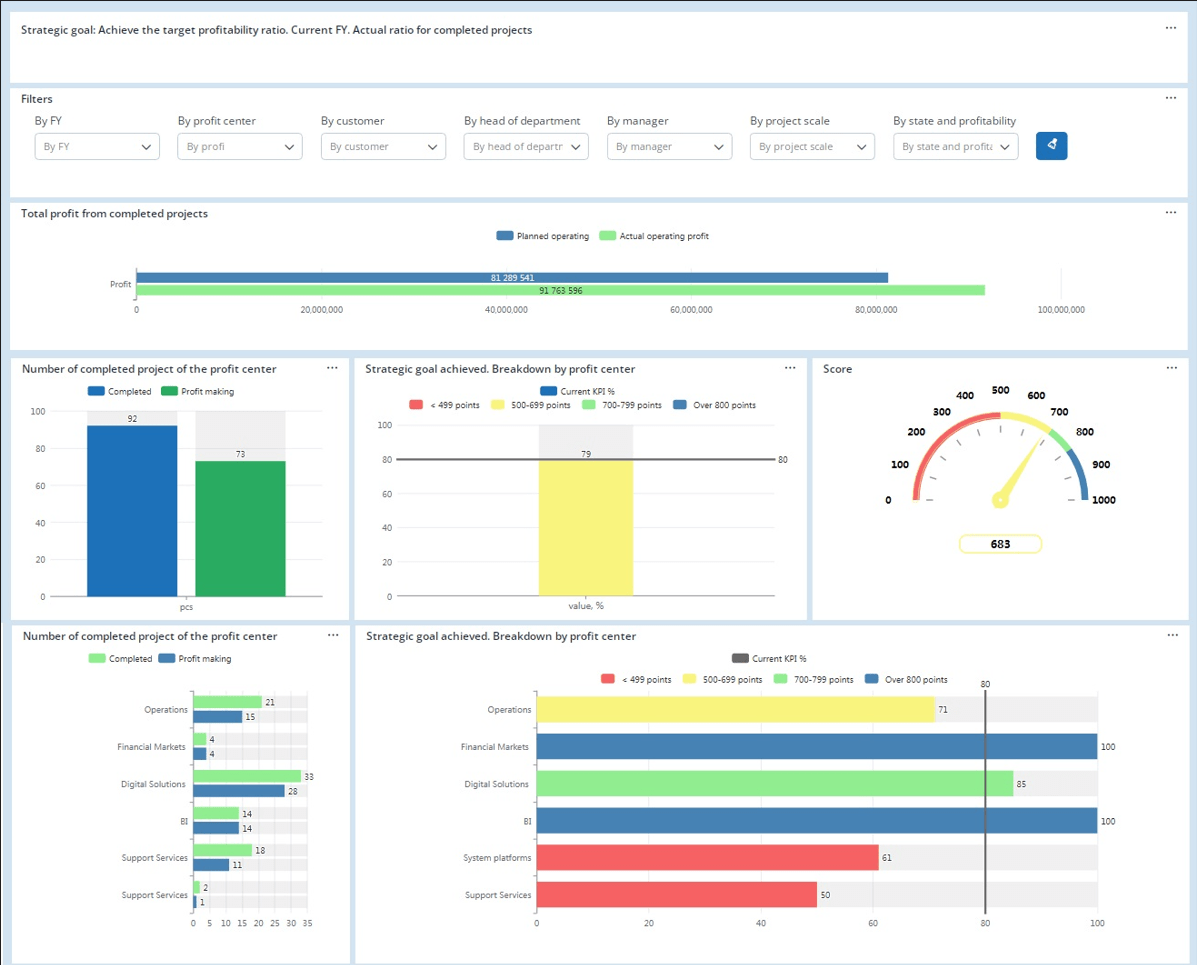
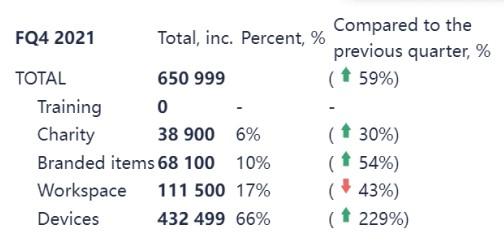
Analyze interdependencies and relations between data. Re-generate separates charts and diagrams depending on the selected component and discover trends, patterns and relationships. Export data and generate printable reports in any convenient format
Analyze interdependencies
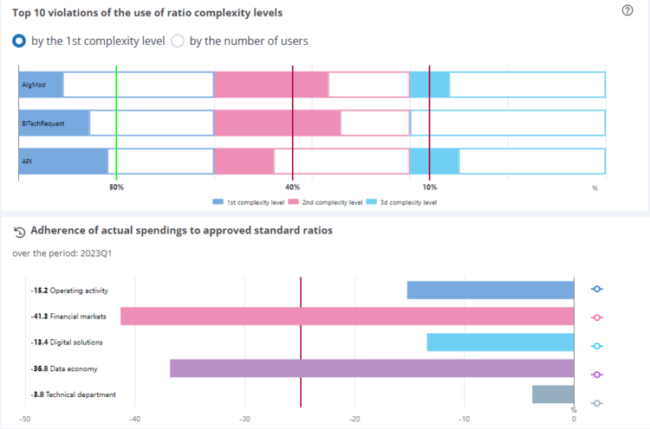
Use configurable indicators of different colors to highlight incidents
Export data and generate reports
Microservice
Architecture
Digital Q.Sensor is one of a few business analytics solutions built on the microservice architecture, which guarantees its high performance, flexible scalability, high availability and fault tolerance.
The solution ensures quick and easy implementation of changes in existing dashboards, setup of new dashboards and customization of preset templates.
Recognized Technologies


any questions?
Contact us
Contact Us
Request a demo
Download the product overview
Request the benchmark report
Register for the Webinar
Using a Product Factory to quickly design and launch digital products & services for your bank